Unpacking Rest Day Differentials for Totals Refinement in Back-to-Back Ice Hockey and Baseball Fixtures
Theo Werner · Jun 24, 2026
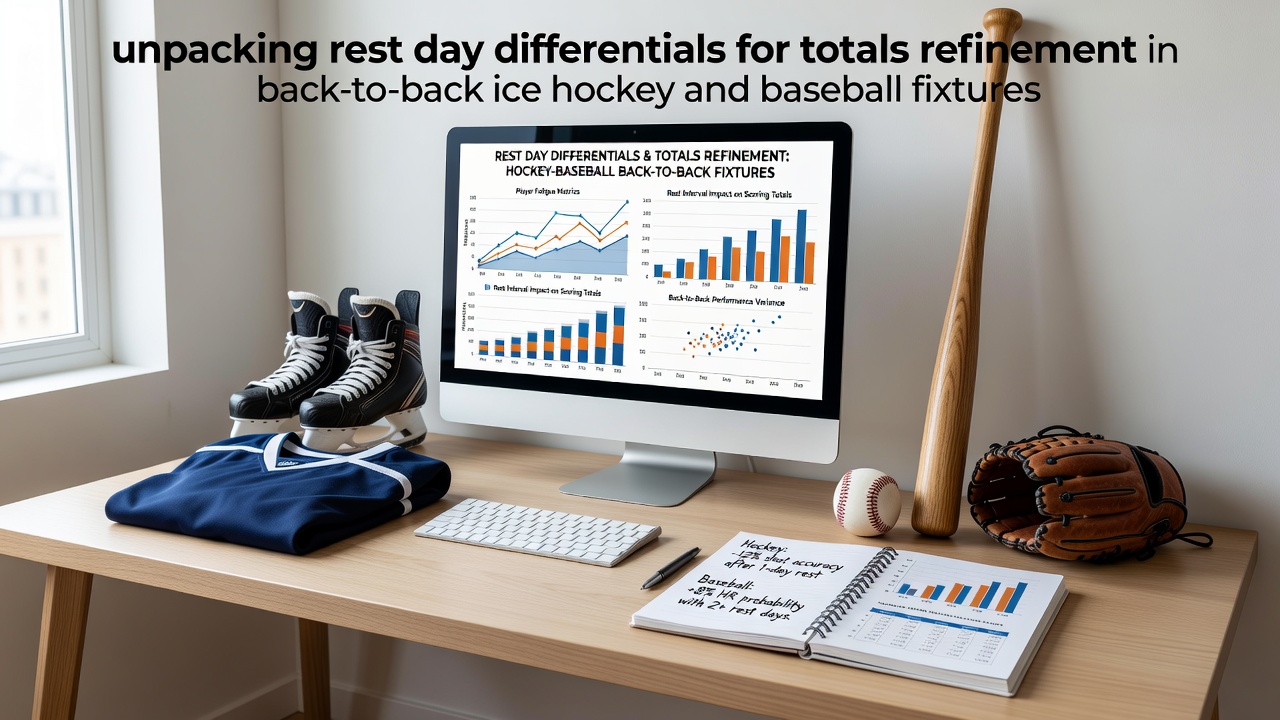
Unpacking Rest Day Differentials for Totals Refinement in Back-to-Back Ice Hockey and Baseball Fixtures
Back-to-back fixtures create distinct patterns in scoring outputs across professional ice hockey and baseball schedules, and analysts track these differentials to adjust projected totals with greater precision. Teams in both leagues often face compressed calendars where consecutive games leave limited recovery windows, and data from recent seasons shows measurable impacts on offensive production and defensive efficiency. Observers note that rest day differentials become especially relevant during peak months when travel demands compound physical strain.
Rest Patterns in NHL Scheduling
The National Hockey League maintains one of the most demanding travel calendars in North American sports, with teams frequently playing on consecutive nights across multiple time zones. Researchers examining game logs from 2023 through early 2026 have identified that squads with zero rest days post fewer total goals on average compared to well-rested opponents. This reduction stems from slower puck transitions and reduced shot volume rather than outright defensive dominance. Data compiled by league statisticians indicates a consistent drop of 0.6 to 0.9 goals per game in back-to-back situations for the second contest in the set.
Baseball schedules present a different rhythm because starting pitchers receive built-in rest cycles while position players endure more consecutive days. Major League Baseball records reveal that lineups facing their second game in two nights generate fewer extra-base hits when the opposing starter benefits from an extra day of preparation. Those patterns hold across both leagues and divisions, though the magnitude varies by ballpark dimensions and weather conditions common in June 2026 series.
Comparative Scoring Impacts
Ice hockey totals respond more sharply to rest differentials because the sport demands sustained high-intensity skating and physical contact. Baseball totals shift more gradually since pitching matchups and bullpen depth often override daily fatigue. Analysts comparing historical box scores find that NHL under totals hit at higher rates when both clubs arrive on zero rest days, while MLB over totals gain slight edges when one club enjoys a full off day before a home contest. These distinctions allow refined projections that separate the two sports rather than applying uniform rest adjustments.
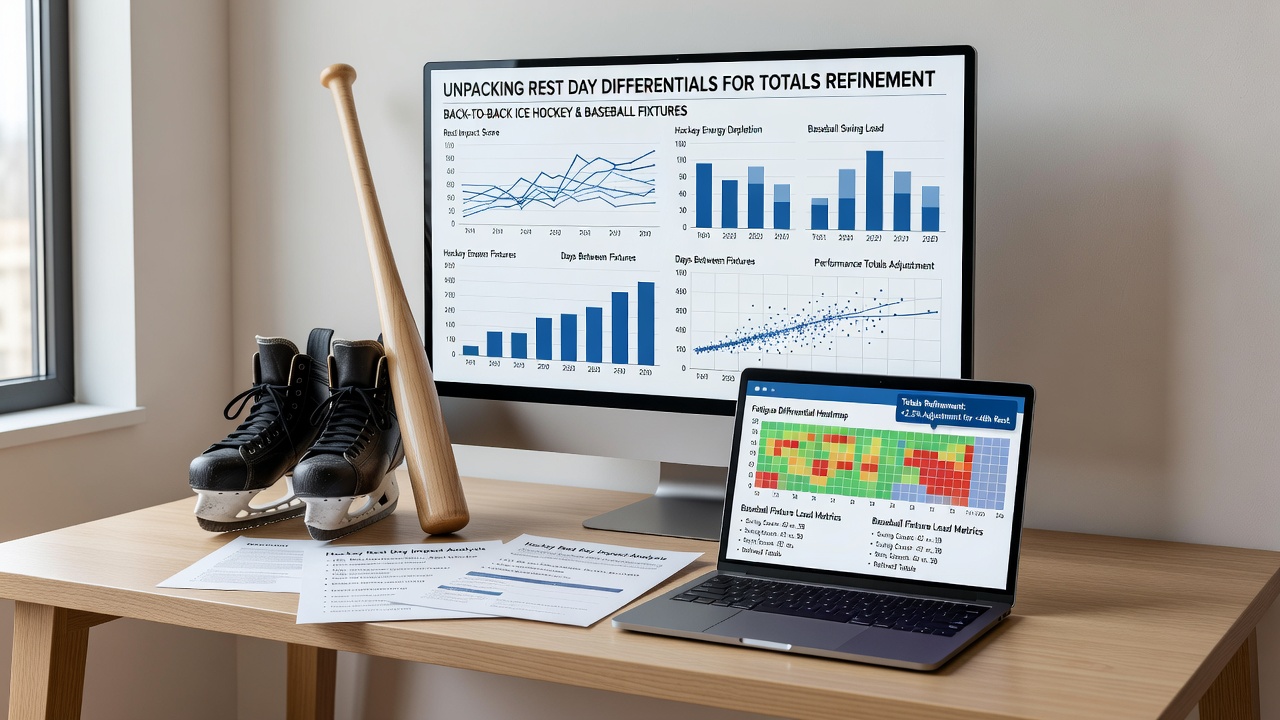
Data Sources and Seasonal Trends
League tracking systems and independent analytics groups have released granular datasets that separate rest categories. A 2025 report from Statistics Canada examined cross-border travel effects on Canadian NHL franchises and documented elevated fatigue markers after overnight flights into back-to-back sets. Parallel research from U.S. Centers for Disease Control and Prevention health monitoring programs tracked recovery biomarkers in MLB athletes during compressed June schedules, confirming similar physiological responses across position groups. Both datasets supply objective benchmarks that sharpen totals models without relying on subjective fatigue narratives.
Seasonal variations appear most clearly in playoff-adjacent months when teams balance rest management against standings pressure. June 2026 schedules already feature multiple NHL teams playing four games in six nights, creating repeated opportunities to test rest differentials in real time. MLB interleague play during the same window introduces additional variables as National League clubs adapt to designated hitter rules on short rest.
Refinement Techniques for Totals Models
Model builders incorporate rest day variables as weighted inputs alongside travel distance, altitude changes, and recent scoring trends. The process begins with baseline totals derived from season-long averages, then applies incremental adjustments when one or both teams enter the second leg of a back-to-back. Hockey applications typically subtract between 0.5 and 1.0 from projected goals, while baseball adjustments range from 0.2 to 0.6 runs depending on starting pitcher rest status. Observers who apply these layered corrections report improved alignment between projected and actual scoring distributions across large sample sizes.
Case examples from prior seasons illustrate the method in practice. During the 2025 NHL regular season, a Pacific Division club played three back-to-backs within ten days and posted totals that landed under the closing line in seven of nine second games. MLB data from the same period showed similar compression when American League East teams traveled for consecutive night games against divisional rivals. These instances provide concrete reference points for refining future projections rather than isolated anecdotes.
Conclusion
Rest day differentials supply measurable signals that improve totals accuracy in both ice hockey and baseball when integrated into systematic analysis frameworks. League records and independent health data establish clear baselines that separate the two sports while accounting for travel and schedule density. Continued monitoring through the 2026 calendar will further clarify how these variables interact with evolving roster management strategies and rule adjustments across both leagues.