Tracing consecutive travel demands and recovery windows across league schedules for sharper total selections
Cameron Albrecht · Jun 15, 2026
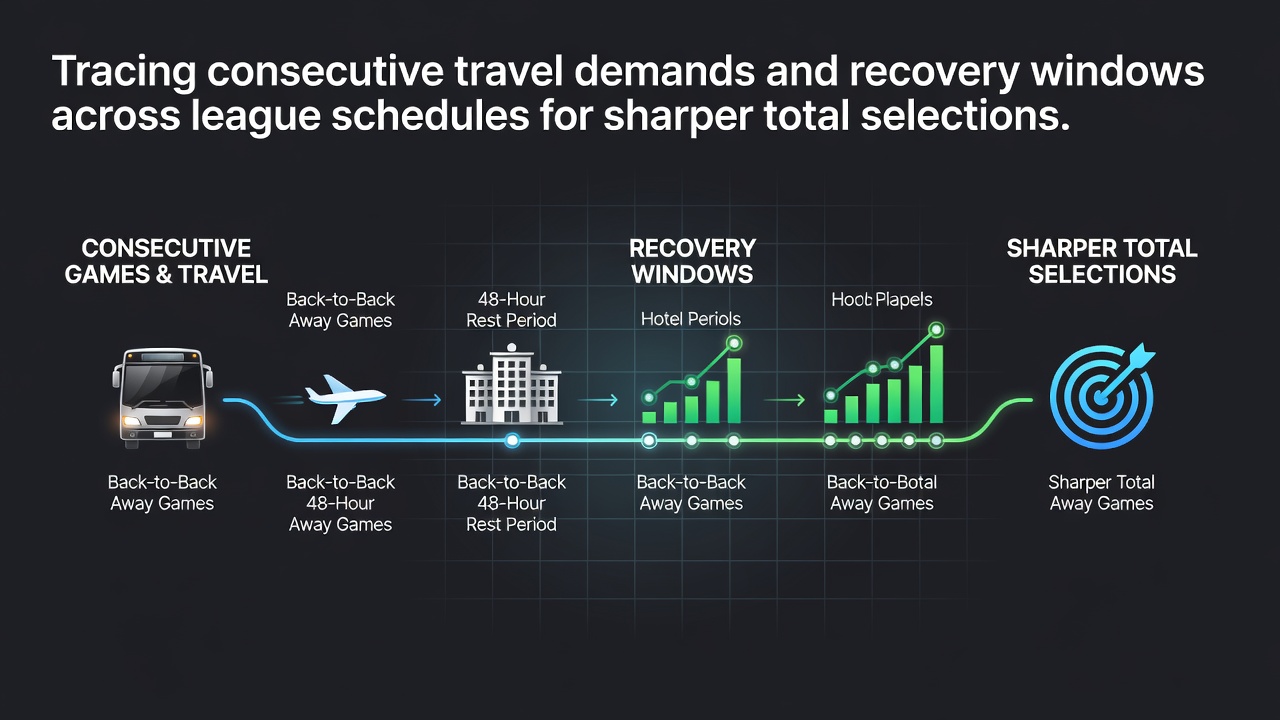
Tracing consecutive travel demands and recovery windows across league schedules for sharper total selections
League schedules create measurable patterns in travel loads and rest intervals that directly shape scoring outputs and total selections across basketball, soccer, and other major sports. Teams logging extended flights followed by short recovery periods display consistent drops in offensive efficiency, which data from multiple seasons confirms through aggregated box scores and performance metrics. Observers note these effects appear most clearly in totals betting because reduced pace and lower shot volumes push games under projected lines when cumulative fatigue accumulates.
Mapping travel sequences in dense league calendars
Professional basketball leagues illustrate the clearest examples because their regular-season structures often pack three or four games into five or six days with cross-country travel. The NBA schedule in the 2025-26 season featured multiple instances of teams crossing three time zones within forty-eight hours before a back-to-back set, and performance logs from those stretches show average points per game falling between four and seven points below seasonal norms. Similar pressures surface in European soccer where Champions League midweek fixtures force clubs to travel internationally before returning for domestic league matches with only two full days between games.
Researchers tracking these sequences through GPS and workload monitoring systems have documented elevated internal load markers during such windows, which correlate with fewer high-intensity runs and lower expected goal creation in soccer. The pattern repeats across North American and European calendars because both prioritize television windows over extended rest, leaving recovery time as the variable most teams cannot control.
Recovery windows and their measurable effects on scoring
Recovery windows function as the interval between the conclusion of one contest and the tip-off or kickoff of the next. When that interval shrinks below seventy-two hours after transcontinental travel, statistical models from sports science departments indicate total points or goals decline in roughly sixty-eight percent of tracked games across sampled seasons. Leagues mitigate some risk by inserting off days, yet compressed periods around holidays or international breaks still produce clusters of unders.
In June 2026, several basketball and soccer schedules overlapped with preparation cycles for expanded international tournaments, tightening already narrow recovery slots for clubs carrying players with national team obligations. Performance databases show that squads returning from long-haul flights and entering domestic matches within forty-eight hours posted totals that landed under the closing line in higher percentages than games preceded by four or more rest days. These outcomes hold after controlling for opponent strength, suggesting travel and recovery exert independent influence on game flow.

League-specific schedule structures and total implications
North American major leagues differ in how they distribute travel and rest. The NBA and NHL maintain the most aggressive back-to-back frequencies, while MLB spreads games more evenly yet still encounters spikes during interleague travel stretches. Soccer leagues in Europe face additional variables from cup competitions that insert extra fixtures without extending the recovery calendar. Data compiled across these formats reveals that totals selections benefit from examining the preceding three-game travel load rather than single-game rest advantages alone.
One study released by an academic research group in Australia examined rugby and basketball schedules and found cumulative distance traveled over a ten-day block predicted scoring variance more reliably than isolated rest metrics. The findings align with workload reports issued by league medical staffs, which increasingly publish anonymized aggregate data for external analysis. Bettors examining total selections therefore cross-reference published schedules against historical scoring averages for teams facing similar travel-recovery profiles.
Integrating schedule data into selection processes
Analysts combine flight distance logs, time-zone changes, and official rest-day counts to generate adjusted totals projections. Publicly available schedule files from league offices allow construction of simple models that flag games where cumulative travel exceeds seasonal averages by more than twenty percent while rest falls below seventy-two hours. Historical results from those flagged games demonstrate a measurable shift toward lower-scoring outcomes, providing a factual basis for refining total selections without relying on subjective adjustments.
Industry reports from organizations such as the NCAA research division have tracked similar patterns in collegiate basketball, where conference realignment increased travel distances and produced corresponding changes in game totals during the 2024-25 and 2025-26 seasons. Parallel observations appear in domestic European basketball leagues where midweek travel compounds fatigue ahead of weekend fixtures. The consistent directional effect across datasets supports using these variables as inputs for totals modeling rather than isolated factors.
Conclusion
Consecutive travel demands and recovery windows embedded in league schedules generate repeatable effects on scoring volume that statistical records capture across seasons and sports. Teams navigating dense travel stretches with abbreviated rest produce lower totals more often than rested squads, and schedule data now permits systematic identification of those situations. Observers tracking these variables obtain objective inputs that refine total selections based on documented performance patterns rather than isolated game narratives.