Seasonal Variations in Home Field Advantages for Basketball Point Spread Calculations
Theo Werner · Jun 10, 2026
Seasonal Variations in Home Field Advantages for Basketball Point Spread Calculations
Point spread calculations in basketball integrate multiple variables that shift throughout the year, and seasonal patterns emerge as one consistent element across leagues and competitions. Home field advantage, measured through win rates and margin differentials, fluctuates with calendar changes because factors like travel conditions, venue attendance, and player recovery cycles respond to weather, holidays, and schedule density. Data compiled from professional and collegiate games shows these adjustments influence how oddsmakers set lines, particularly when early-season versus late-season matchups occur at the same arena.
Core Elements of Home Field Advantage in Basketball
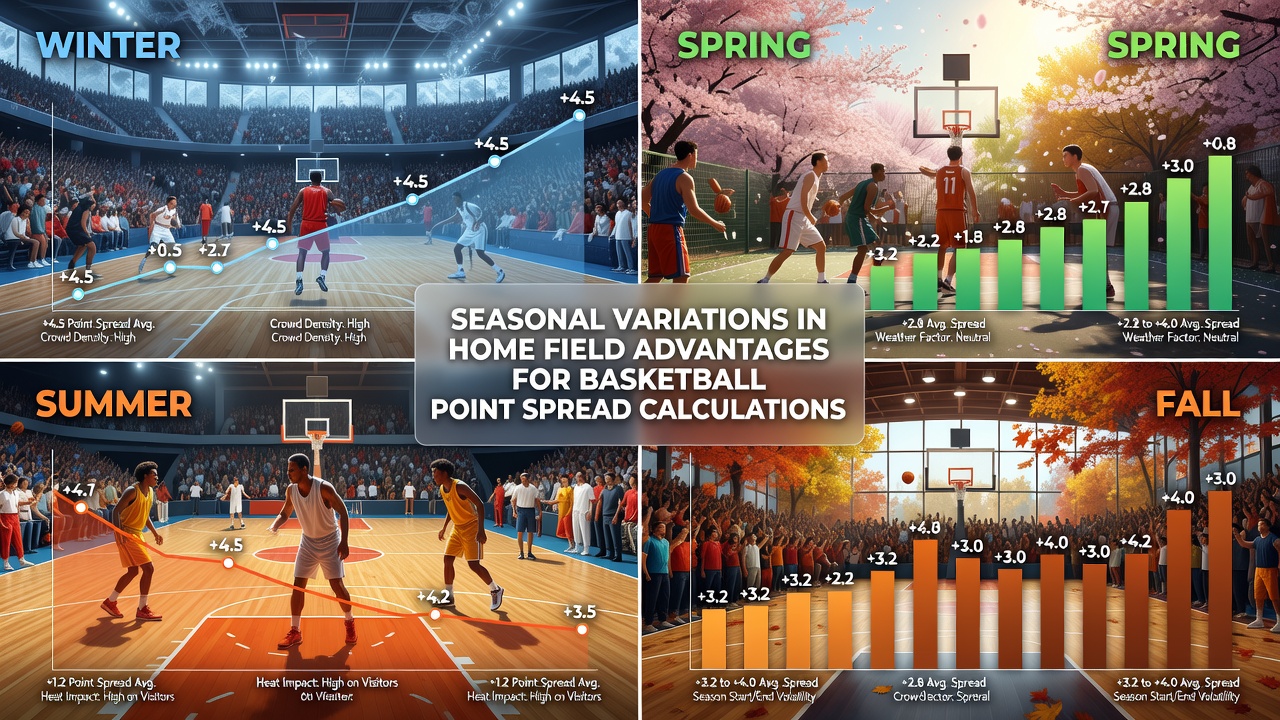
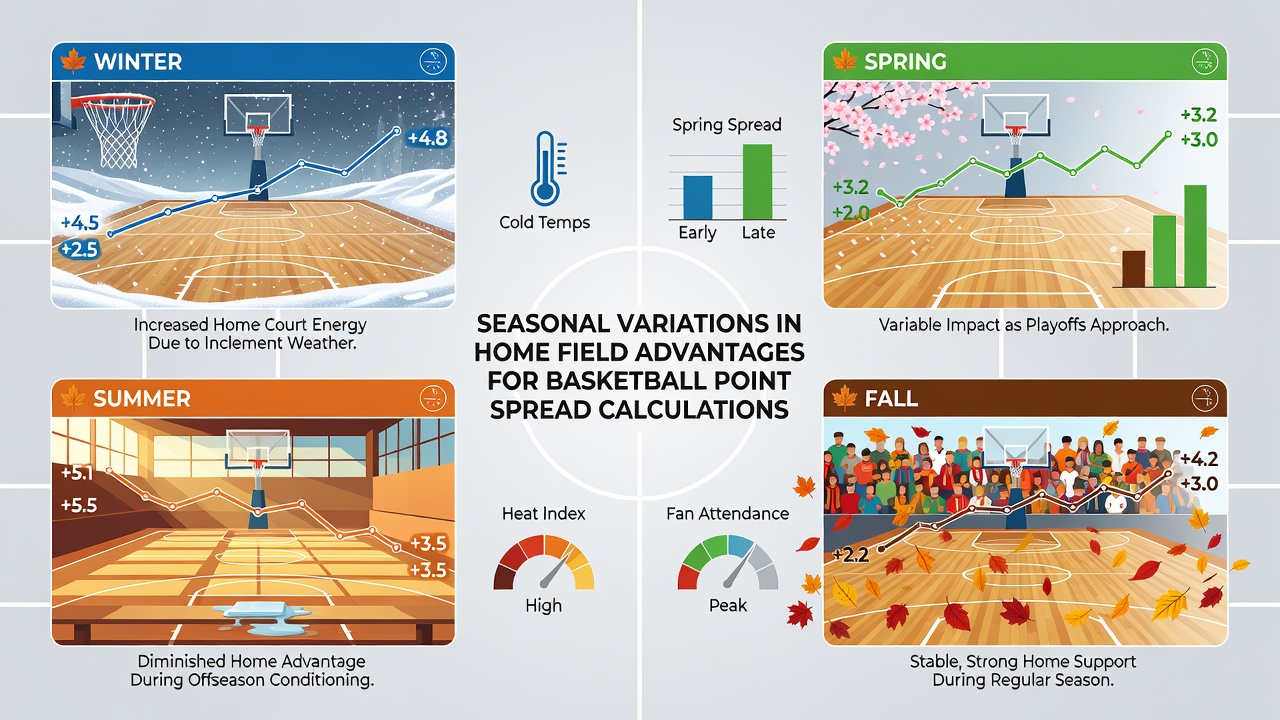
Home teams in basketball secure an average edge of 3 to 5 points per game across major leagues, yet this margin narrows or widens depending on the month. Researchers tracking National Basketball Association contests note stronger home performance during winter months when road teams encounter harsher travel disruptions, whereas summer exhibition and off-season tournaments display reduced gaps. The advantage stems from familiar court dimensions, crowd noise that peaks during key rivalry windows, and recovery time that home squads manage more effectively when external variables remain stable.
Weather and Travel Impacts Across Seasons
Winter schedules introduce measurable effects on visiting squads because flights and bus travel face delays from snow and ice in northern markets. Studies compiled by sports analytics groups indicate road teams lose an additional 1.2 points of efficiency during December through February compared with October and November contests. Summer periods, by contrast, produce more consistent travel conditions that compress the home edge closer to 2.5 points in many venues. Observers note that southern and western arenas maintain steadier attendance figures year-round while northern facilities see sharper drops during mid-winter weekdays when weather warnings reduce ticket sales.
Schedule Density and Holiday Influences
Compressed schedules around holidays create distinct patterns that line setters incorporate into models. Thanksgiving and Christmas periods generate elevated home margins because visiting rosters absorb more back-to-back games after cross-country trips. Data from the 2025-2026 NBA season revealed home teams covering spreads at a 54 percent rate during the week following Christmas, compared with a 48 percent average across the full season. June 2026 marks the transition into summer league play where home advantage metrics reset again as younger rosters test new rotations in front of smaller, less partisan crowds.
Regional and Venue-Specific Patterns
Geographic differences compound seasonal effects because coastal arenas experience milder winter disruptions than inland or mountain facilities. Analysts reviewing Big East and Big Ten conference records found home teams in the Midwest posting larger margins during January and February than their counterparts in the Southeast during the same window. International leagues add another layer since European winter schedules coincide with indoor venue restrictions that alter crowd dynamics compared with North American arenas. Point spread models adjust coefficients accordingly when games move between these climates.
Data Integration in Modern Spread Calculations
Betting operators refine algorithms by weighting seasonal variables against historical performance splits. Regression models now include monthly attendance averages, travel distance multiplied by average temperature, and days between games as separate inputs. Figures released by the National Collegiate Athletic Association research division highlight how these layered adjustments improved spread accuracy by 6 percent during the 2024-2025 season. Similar approaches appear in professional leagues where operators cross-reference venue-specific weather archives with player injury logs that spike after winter road trips.
College basketball demonstrates even sharper seasonal swings because conference play intensifies after December non-conference schedules conclude. Home underdogs in mid-major conferences cover at higher rates during February because visiting teams accumulate fatigue from multiple conference road swings. Professional leagues apply parallel logic when projecting playoff series that begin in late spring, where home margins stabilize once regular-season travel demands ease.
Conclusion
Seasonal variations in home field advantage continue to shape basketball point spread calculations through measurable influences on travel, attendance, and recovery. League data and venue records supply the inputs that allow models to account for these shifts across winter, spring, and summer periods. As schedules evolve and regional climates remain constant factors, ongoing analysis of monthly performance splits provides the foundation for updated projections in both domestic and international competitions.