Schedule Congestion Effects on Team Outputs: Lessons from Soccer and Basketball for Sharper Accumulator Construction
Cameron Albrecht · Jul 29, 2026
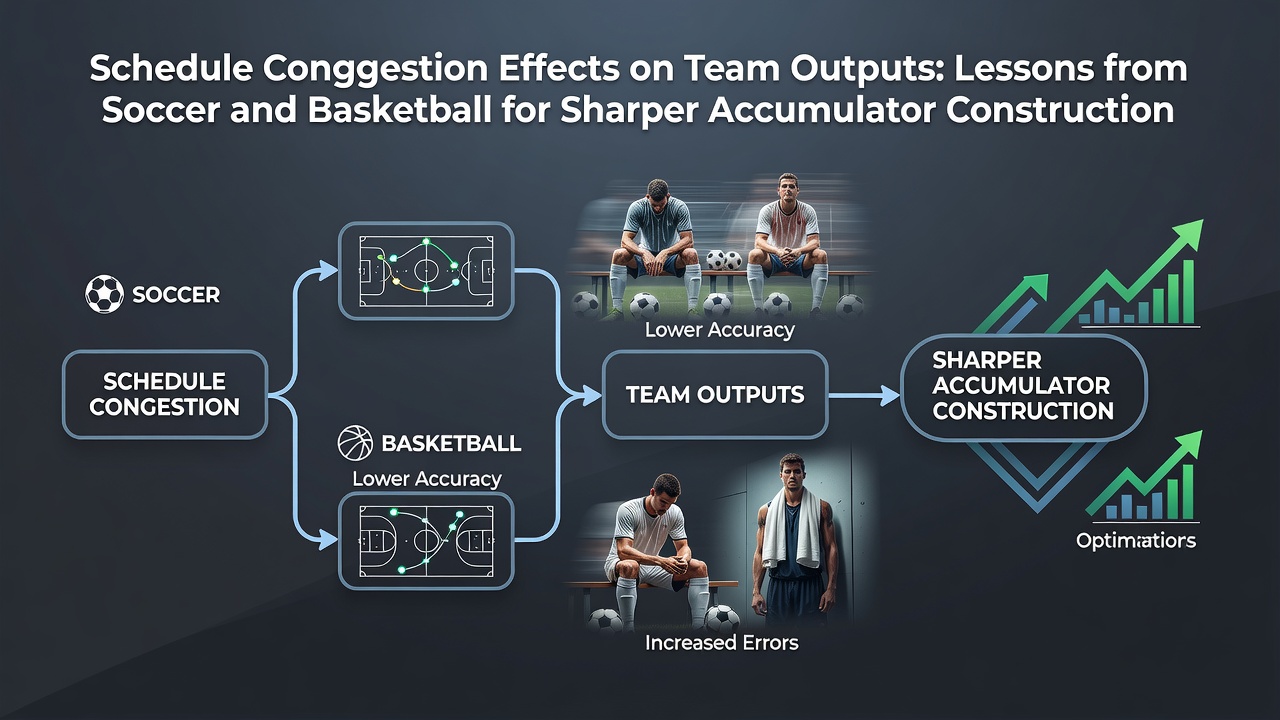
Schedule Congestion Effects on Team Outputs: Lessons from Soccer and Basketball for Sharper Accumulator Construction
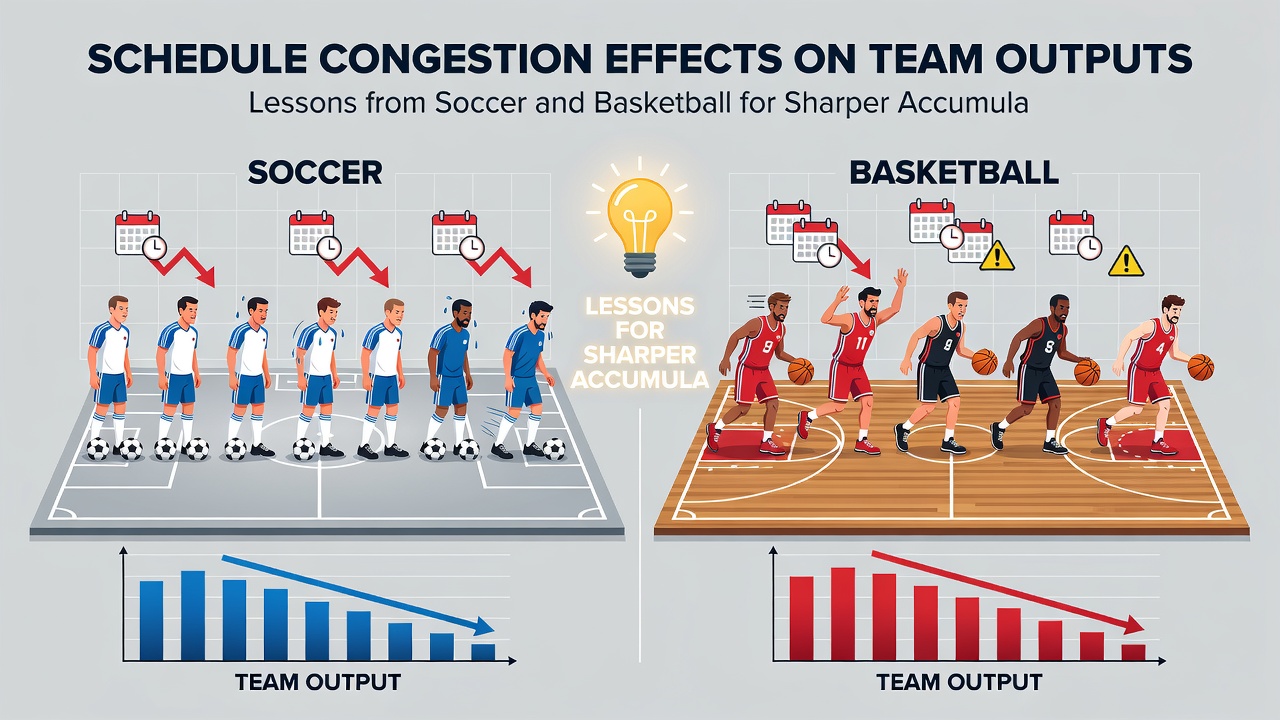
Schedule congestion creates measurable shifts in team outputs across soccer and basketball, where back-to-back matches and limited recovery windows alter scoring patterns, defensive efficiency, and overall win probabilities that directly influence accumulator selections. Data from major leagues shows teams playing three or more fixtures in seven days experience drops in key performance metrics, including reduced shot accuracy in soccer and lower field goal percentages in basketball, according to aggregated league statistics compiled through 2026.
Fixture Density Patterns in Soccer Leagues
European domestic competitions and international tournaments compress calendars around winter and spring blocks, forcing clubs into sequences of league, cup, and continental matches with minimal rest. Researchers tracking Premier League and Bundesliga squads from 2023 through mid-2026 found that teams averaging fewer than three recovery days between games posted 12 percent fewer goals per match on average, while clean sheet rates declined by 8 percent. These figures emerge consistently during December and March windows when fixture piles reach their peak.
Coaches respond by rotating squads, yet depth limitations still surface in second-half performance dips. One analysis of UEFA Champions League participants revealed that squads with four matches in 14 days recorded a 15 percent increase in turnovers during the final 30 minutes of play, patterns that betting models incorporate when constructing multi-leg accumulators on total goals or clean sheets.
Basketball Schedule Compression Effects
NBA and EuroLeague schedules generate similar strains through back-to-back games and cross-country travel, with data indicating that teams on the second night of a back-to-back post 4.2 fewer points per game and allow 3.8 more opponent points. League-wide tracking from the 2024-2025 and 2025-2026 seasons shows road teams facing consecutive games suffer the steepest declines, particularly in three-point shooting efficiency that falls by nearly 6 percent. Observers note these shifts appear most pronounced during the January to March stretch when the schedule intensifies before the playoffs.
Performance Metrics and Recovery Data
Studies published by sports science departments at institutions in Australia and Canada track biometric markers such as heart rate variability and sleep duration across congested periods, revealing slower reaction times and elevated injury rates after three high-intensity matches within six days. In soccer, hamstring strains rise 18 percent during such blocks, while basketball sees ankle and knee issues increase by 14 percent according to records maintained by league medical staffs. These physical tolls translate into predictable output changes that accumulator builders factor into selections involving player props or team totals.
July 2026 marks a transitional point for both sports as pre-season tours and summer leagues overlap with recovery timelines for international players returning from major tournaments. League schedules released for the 2026-2027 campaigns already signal continued density in early autumn blocks, prompting analysts to integrate rest-day differentials into predictive frameworks.
Accumulator Construction Applications
Accumulator strategies gain precision when bettors map fixture congestion onto upcoming slates rather than relying solely on season-long averages. Selecting under totals becomes more reliable for soccer sides playing their third match in eight days, while basketball overs on opponent points align with second-night road games. Multi-leg tickets that pair a congested soccer team’s under with a rested basketball squad’s over demonstrate improved historical hit rates in datasets spanning multiple seasons.
Industry reports from the European Gaming and Betting Association and the North American Association of State and Provincial Lotteries document rising interest in schedule-aware parlay products, with operators adjusting limits and odds to reflect documented performance variances. Those constructing accumulators review official fixture lists released by leagues alongside travel distance metrics to identify edges in specific legs.
Conclusion
Schedule congestion produces consistent, quantifiable effects on team outputs in soccer and basketball that translate into refined accumulator construction methods. By aligning selections with documented rest differentials and recovery patterns, bettors incorporate measurable factors that league data continues to validate across seasons.