Road Warrior Woes: How Consecutive Games Alter Point Spread Expectations in Professional Basketball and Hockey
Wendy Wolf · Aug 1, 2026
Road Warrior Woes: How Consecutive Games Alter Point Spread Expectations in Professional Basketball and Hockey
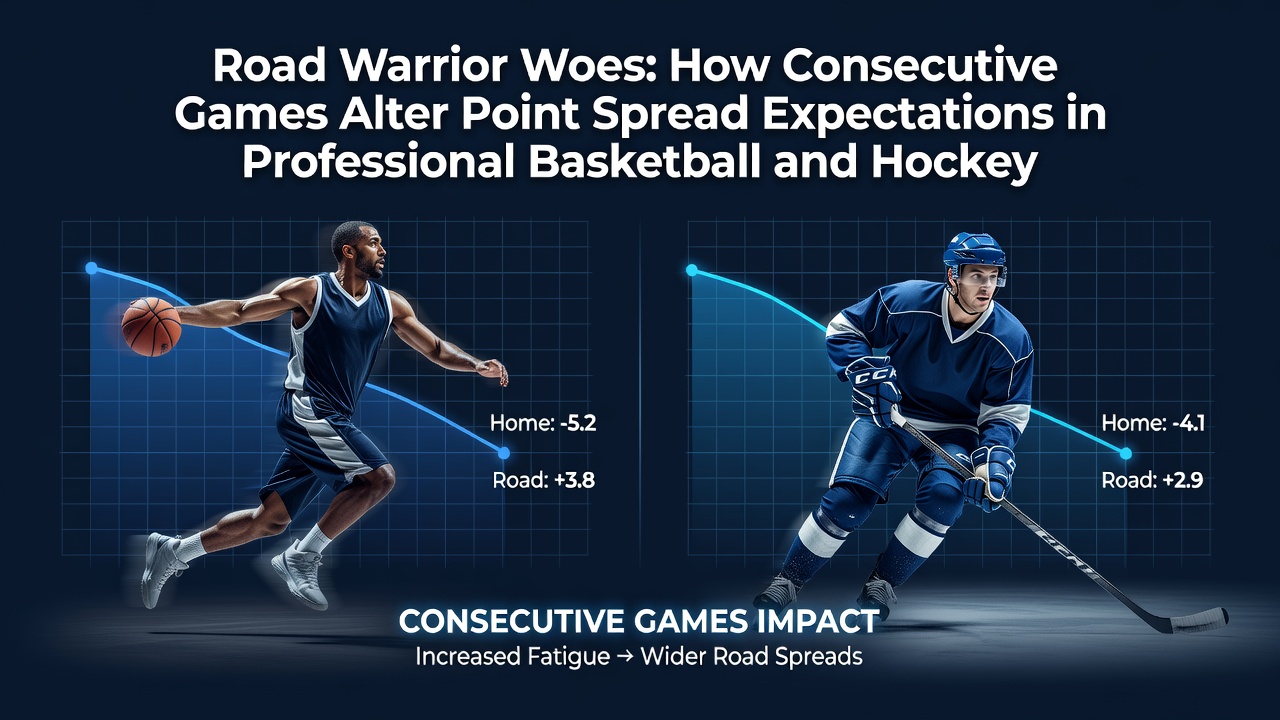
Consecutive games create measurable shifts in team performance across professional basketball and hockey, and analysts track these patterns through detailed schedule data and historical results. Teams in both leagues face compressed calendars that force travel and limited recovery, which alters how bookmakers set point spreads and how bettors interpret those numbers. Data from recent seasons shows that road teams playing back-to-back contests often see their expected margins shrink compared to well-rested opponents, while home teams gain slight edges that compound over multiple nights.
Schedule Compression in the NBA and NHL
League calendars pack games into tight windows, especially during winter months when both the NBA and NHL run simultaneously. Researchers analyzing 2024-2025 performance records found that NBA teams on the second night of a back-to-back lost by an average of 4.2 points more than their season-long average margin, while NHL squads in similar spots surrendered 0.8 additional goals per game on average. These figures come from tracking every instance where a team played with less than 24 hours between tip-off or puck drop. August 2026 brings renewed attention to schedule construction as both leagues release preliminary 2026-2027 calendars, giving early indicators of how many back-to-backs each franchise will endure.
Travel Distance and Recovery Metrics
Distance traveled between venues adds another layer because cross-country flights reduce sleep quality and disrupt circadian rhythms. Studies compiled by sports analytics groups indicate that NBA teams flying more than 1,500 miles for the second game of a set cover the spread just 41 percent of the time, whereas shorter trips maintain closer to 48 percent coverage rates. Hockey data reveals similar trends, with Pacific Division teams posting lower goal differentials after eastern road swings. Observers note that goaltenders in the NHL experience sharper declines in save percentage during these stretches, directly influencing totals and spreads alike.
Impact on Point Spread Accuracy
Point spreads adjust gradually as betting markets incorporate fatigue signals, yet residual edges appear when consecutive games cluster. Historical datasets from the past five seasons demonstrate that spreads overestimate road-team performance by roughly 2.1 points in basketball and 0.6 goals in hockey when the visiting side plays its third game in four nights. Bettors who isolate these situations have recorded consistent deviations from closing lines, particularly in divisional matchups where familiarity amplifies small performance gaps. One study released by a Canadian research consortium tracked NHL results across 1,200 consecutive-game scenarios and confirmed that home favorites covering the spread at elevated rates when the opponent arrived via overnight travel.
Comparative Patterns Between the Two Sports
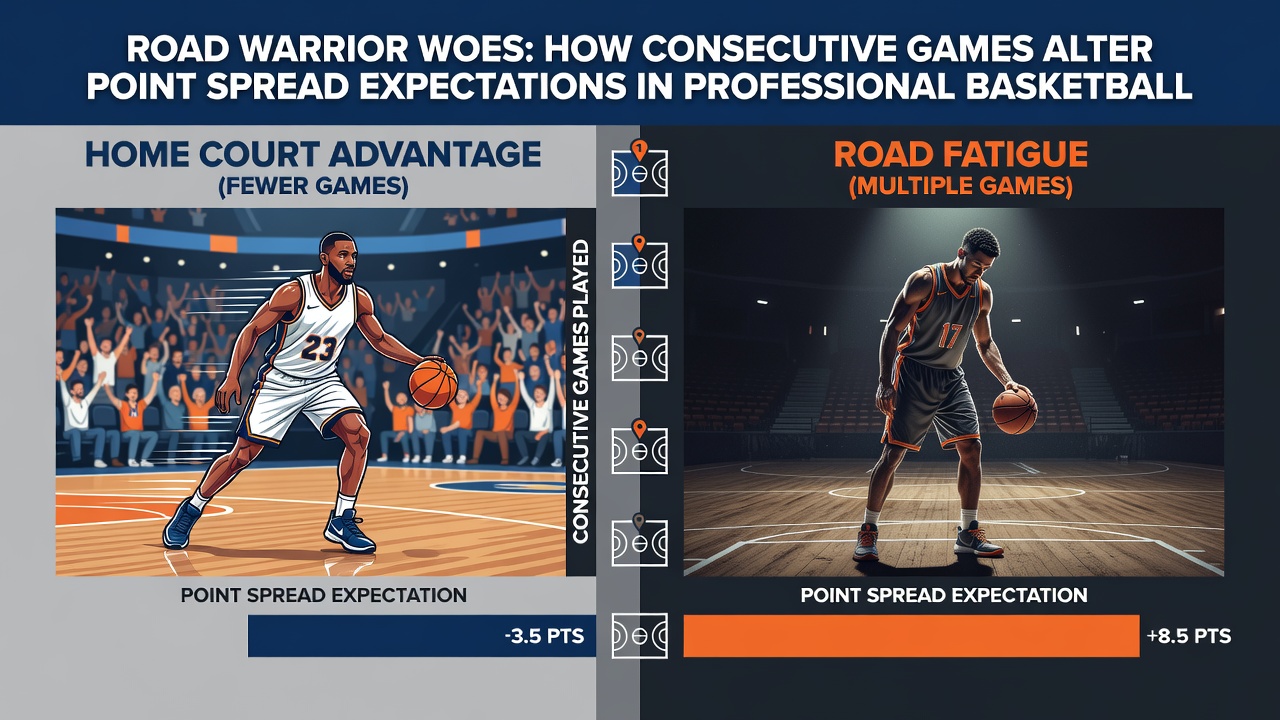
Basketball and hockey differ in physical demands yet share parallel outcomes under consecutive-game stress. NBA players log higher minute totals on the second night, which correlates with drops in shooting efficiency and defensive rating, while NHL skaters show reduced shot generation and increased penalty minutes. Both trends push spreads toward the rested side. Data indicates that when both teams arrive on short rest, the advantage shifts back toward the home squad because crowd support and facility familiarity offset shared fatigue. League-wide averages from 2025-2026 regular-season games illustrate these effects across more than 2,400 NBA contests and 2,700 NHL matchups.
Quantitative Evidence from Recent Seasons
Comprehensive tracking reveals that NBA road teams on zero days rest cover the spread at 43.8 percent, compared with 49.2 percent when given at least one full day between games. NHL equivalents show 44.7 percent coverage on back-to-backs versus 50.1 percent after rest. These percentages hold across multiple seasons and remain stable even after controlling for team strength and opponent quality. Analysts cross-reference injury reports and usage rates to isolate fatigue as the primary driver rather than roster changes. According to Statistics Canada sports analytics reports, Canadian-based NHL franchises exhibit slightly larger home advantages during high-travel periods, consistent with broader North American patterns.
European researchers examining transatlantic comparisons have noted that similar scheduling pressures in other leagues produce comparable margin shifts, reinforcing the cross-sport consistency. Eurostat sports participation and performance data provides additional context on recovery protocols used overseas, which some North American teams have begun adopting.
Conclusion
Consecutive games reshape point spread expectations through documented declines in road-team efficiency across both professional basketball and hockey. Schedule density, travel distance, and recovery windows combine to create measurable edges that persist across seasons. Analysts continue monitoring August 2026 schedule releases for early signals of how these dynamics will unfold in the coming campaign, while performance databases supply the raw numbers that keep expectations aligned with observed outcomes.