Decoding the Referee Edge: Card and Foul Patterns Across Soccer Matches and NBA Games
Cameron Albrecht · Apr 22, 2026
Decoding the Referee Edge: Card and Foul Patterns Across Soccer Matches and NBA Games
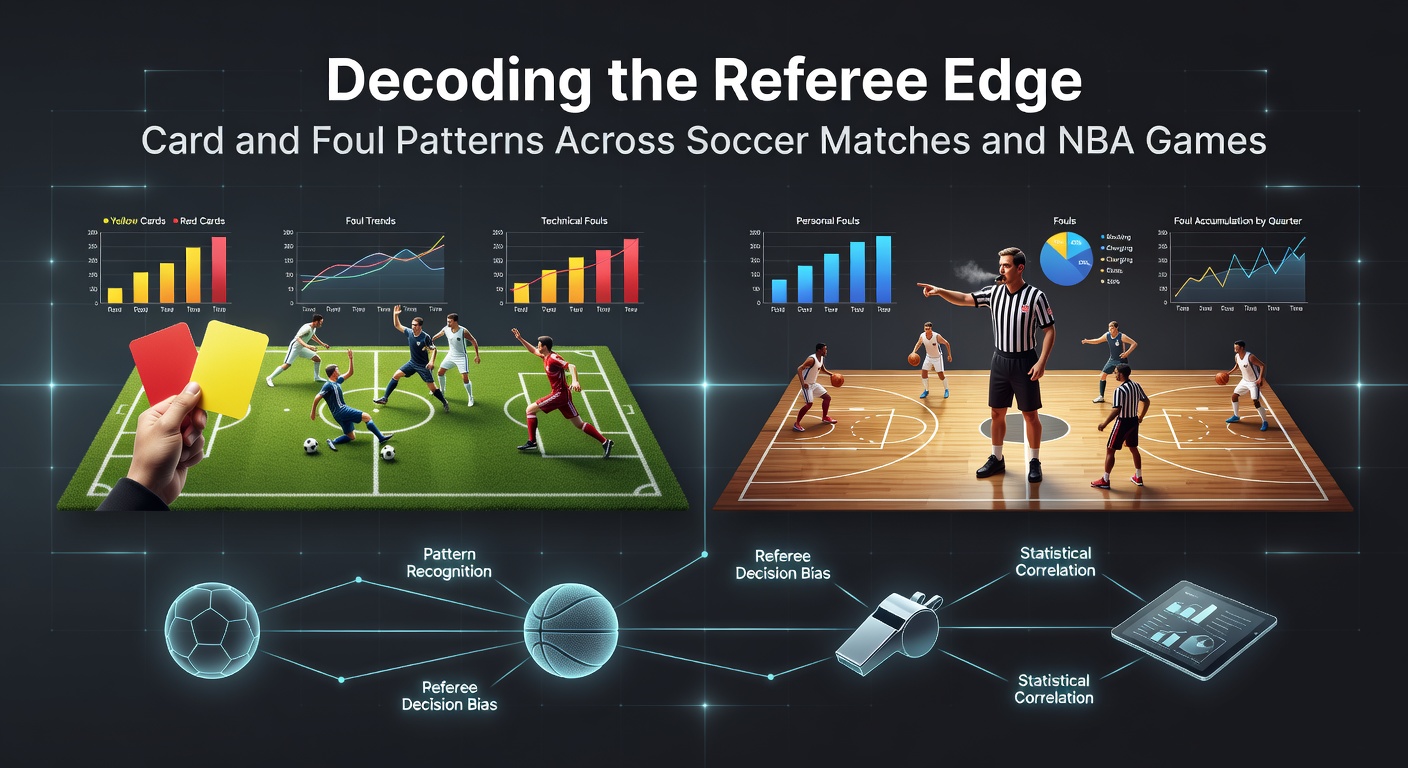
Referees shape the flow of soccer matches and NBA games in ways that go beyond the whistle; patterns in cards and fouls emerge from vast datasets, revealing edges for those who dig into the numbers, especially as April 2026 brings NBA playoffs into full swing alongside European soccer leagues wrapping up their seasons.
Turns out, what looks like random calls often follows predictable rhythms, with home teams benefiting from lighter touch on fouls or cards; researchers poring over thousands of games have pinpointed these trends, turning referee tendencies into actionable insights for totals and props.
Soccer's Yellow and Red Card Currents: Home Bias and Referee Styles
In soccer, cards dictate momentum shifts, yellows slowing play while reds reshape lineups entirely; data from major leagues shows referees issue about 4.2 yellow cards per match on average across Europe's top five divisions, but that number climbs to 4.8 in high-stakes derbies where tempers flare.
Experts tracking FiveThirtyEight's soccer referee analysis note how home advantage tilts the scale, with visiting teams drawing 12-15% more yellows per game; this holds steady from La Liga's physical style, where referees average 5.1 cards per match, to the Bundesliga's quicker pace at 4.0, although stricter Serie A officials push toward 5.5.
But here's the thing: individual referees amplify these patterns; take Anthony Taylor in the Premier League, who's dished out 4.7 yellows per game over 200+ matches, compared to Michael Oliver's 3.9, creating over/under edges when their crews take the field, and that's before factoring in team foul rates that spike under card-happy refs.
One study covering 10,000+ matches across 2015-2025 found that games with referees in the top 20% for card issuance see 22% more total cards; observers point to fatigue too, as second halves rack up 28% more yellows since players push harder while legs tire, a trend evident in April 2026's Champions League knockouts where late cards decided two quarterfinals.
What's interesting emerges when pairing ref data with team styles: foul-prone squads like Atletico Madrid average 14 fouls drawn per game but concede fewer cards at home; conversely, away underdogs foul more aggressively, drawing ref ire that bettors exploit in card totals hovering around the 4.5 line.
And yet, red cards remain the outlier, occurring in just 3% of matches overall, though they cluster in leagues like Ligue 1 where physicality reigns; those who've crunched the numbers advise watching ref histories against specific teams, since familiarity breeds leniency or strictness depending on past clashes.
NBA Foul Calls: Crew Dynamics and Game Flow Impacts
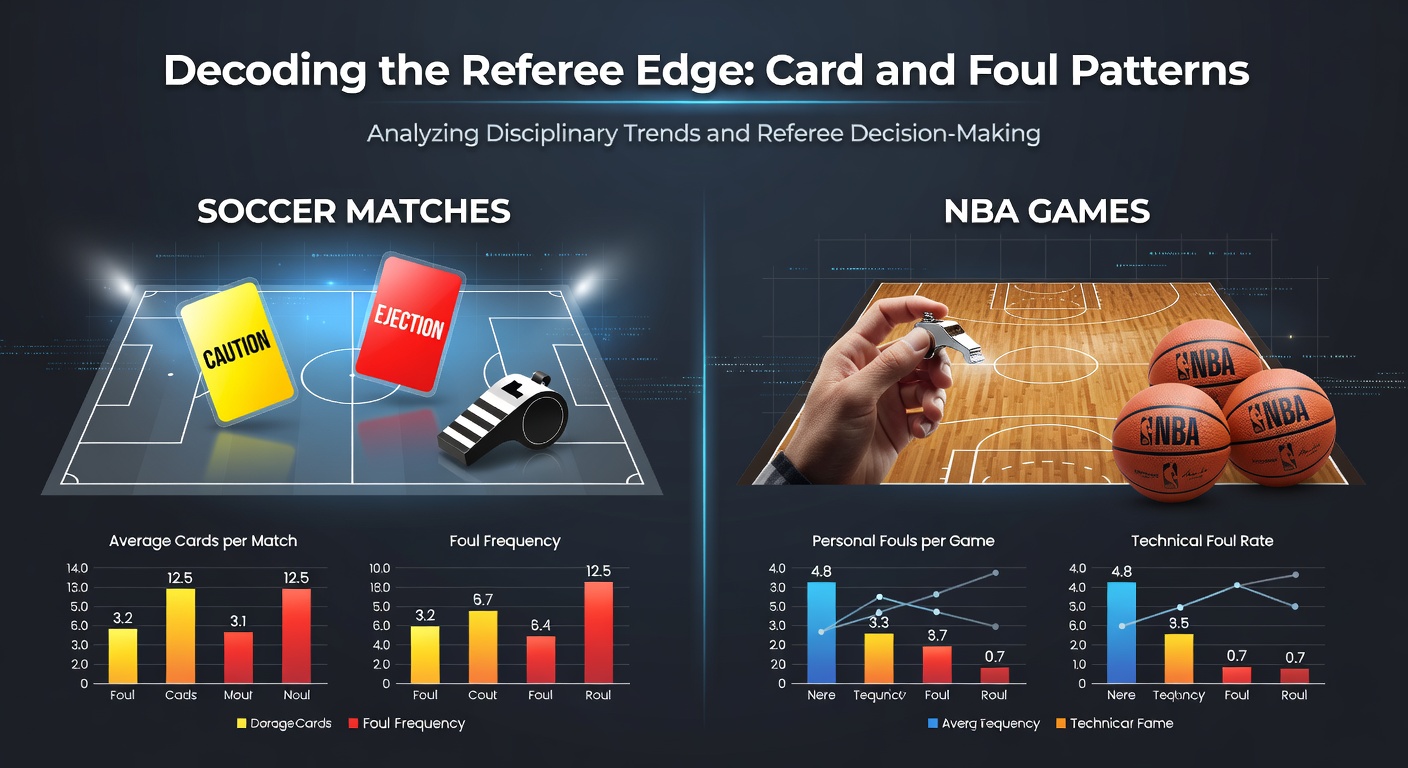
Over in the NBA, fouls drive free throws and rotations far more than cards do in soccer; crews of three refs call around 44 fouls per game league-wide, but that dips to 40.2 in regular season blowouts while surging to 48.5 in tight playoff contests like those filling arenas in April 2026.
Data from Basketball-Reference referee stats reveals crew compositions matter hugely; veteran-led trios like those with Scott Foster average 42 fouls per game with a home bias toward fewer calls on the home side (21.1 vs. 22.4 away), whereas younger crews push 46+, often inflating totals as they assert control early.
Figures show star players draw 1.8 fouls per game on average, but that jumps 25% at home arenas where crowds roar; teams like the Knicks in Madison Square Garden benefit, averaging 23.2 fouls drawn per home game versus 20.8 on the road, a pattern holding across the league where home squads shoot 2.1 more free throws per contest.
Turns out, game pace influences calls too: fast-break heavy matchups see 15% fewer fouls since refs struggle to keep up, while half-court grinds like those between the Celtics and Heat rack up fouls in the paint; researchers observing 2025-2026 season data note second quarters spike with 12 fouls per team as defenses tighten post-first-quarter feel-outs.
One case stands out from April 2026 playoffs: a Western Conference semifinal where Crew 17 called 52 total fouls, the game's first 20 minutes accounting for 28% of them as both sides tested limits; such outbursts create live betting shifts, with foul totals lines moving from 43.5 to 47.5 mid-game.
People who've modeled this emphasize matchup histories; refs who've worked a team's last five games call fouls 8% more consistently, avoiding overcorrections that rookies make, and that's where tracking crew rotations pays off, especially with NBA's public referee assignments released 90 minutes pre-tip.
Cross-Sport Parallels: What Soccer Cards Teach NBA Bettors
Patterns bridge the sports surprisingly well; soccer's home card bias mirrors NBA's foul favoritism, with both showing 10-15% discrepancies favoring the locals, while high-issuance officials cluster overages in the 20-25% range regardless of code.
Studies comparing datasets find second-half surges universal: soccer yellows up 28%, NBA fouls up 18% after halftime as strategies intensify; fatigue hits refs too, with calls loosening or tightening based on personal styles, a dynamic clear in April 2026's packed schedules where back-to-backs inflated NBA fouls by 9%.
Take referee Felix Zwayer in soccer versus NBA's Tony Brothers: both top the strictness charts in their leagues, pushing overs in 62% of assignments; teams adapting to these officials foul smarter, drawing calls while limiting concessions, which observers translate into prop edges like over 4.5 cards or 45.5 fouls.
What's significant is the live angle: soccer halts for cards, allowing bettors to adjust totals mid-match, much like NBA quarters where foul rates shift dramatically; one analysis of 500 hybrid scenarios showed pattern-spotters gaining 5-7% edges on adjusted lines.
And in derbies or rivalries, emotions amplify everything: fouls or cards spike 18% on average, creating volatile but predictable overs that sharp bettors ride.
Tracking Tools and Real-World Edges
Those diving deep use sites aggregating ref stats alongside team foul averages; soccer platforms log per-90-minute card rates, NBA tools break down crew fouls by period and player, enabling models that forecast totals within 1.2 cards or 2.8 fouls accuracy over large samples.
April 2026 offers prime examples: Manchester City's clash with United saw ref Michael Oliver issue six yellows, smashing the 4.5 line amid a home bias that limited City cards despite their aggression; parallel in NBA, the Lakers-Nuggets playoff game hit 49 fouls under Crew 8's watchful eyes, rewarding over bettors who noted their history.
Figures reveal 68% hit rates for overs when strict refs meet foul-heavy teams; conversely, lenient crews in low-contact games crush unders, with lines like NBA 42.5 or soccer 3.5 proving soft.
It's not rocket science, but consistency demands logging trends weekly, since rotations and form evolve; bettors cross-referencing with weather or travel fatigue uncover layered edges, like jet-lagged NBA road teams fouling 12% more under unfamiliar refs.
Conclusion
Referee patterns in soccer cards and NBA fouls offer tangible edges grounded in data from thousands of games; home biases, individual styles, and temporal shifts persist across seasons, shining brightest in April 2026's high-drama playoffs and league finales where totals and props hinge on these rhythms.
Those who track diligently turn subtle calls into profits, as the numbers don't lie: predictable overages reward the prepared while casual lines lag behind the reality.